Everything a report needs, included
More than 150 widgets
Ready-made charts, tables and figures to build any report.
No fee per connection
Every data source is included, and so are your own.
Every site, brand and client
One site, a group, a brand or the whole estate.
Scheduled and shared
Emailed as PDF, Excel or CSV, or shared as a secure link.
YOUR DIGITAL P&L
What you spend, what it brings in, what it returns.
Marketing, takings and costs in the same reports, worked out the same way. Till sales and labour from staff clock-ins come with our tills, which are in Beta.
Spend and costs
Ad spend from Google, Meta, LinkedIn, TikTok and Microsoft, and labour cost worked out from the hours your team clocks.
Every revenue stream
Bookings, rooms, events, online orders, vouchers, memberships and till sales, counted the same way in every report.
Return on every pound
Return on ad spend by channel and campaign, labour as a share of takings and the margin on every dish, side by side.
THE ROI ENGINE
Start from the result you want.
Tell mDOS the goal: a number of enquiries by a date, a revenue figure or a budget. It works out what every stage has to deliver, shows where each figure comes from, then tracks it once you agree.
- One goal in: a number of enquiries by a date, a revenue figure or a budget.
- Every stage gets a target: ads, search, email, landing pages, content, follow-up, social, outreach and reviews.
- Nothing is a guess: each figure shows its source, a benchmark, your own history or your own estimate, and how sure it is.
- You agree it first: targets only go live once you, or your client, agree them.
- Alerts built in: agreed targets feed your alerts, so you hear when a stage slips.
- Worked out in code: the AI never makes up a figure.
THE REPORT IT CREATES
Then see every stage, week by week.
Funnel performance shows the target, the actual and the forecast for each stage, gives each one a plain verdict and names the weakest link.
A verdict per stage
Ahead, on track, behind or failing, with how sure it is.
Context, not just a number
The benchmark range, your own history and the same weeks last year.
A likely finish date
Only shown once the forecast has proved itself on your own history.
The economics
Required spend, break-even return on ad spend and lifetime value against cost per customer.
What is running
The campaigns and tests working on each stage, in plain words.
A trend line per stage
Each stage’s recent weeks at a glance, next to its target.
Three ways to get every number in one place
Build it, connect it, then get it to the right people.
Build a report in minutes
Pick from more than 150 ready-made charts, tables and figures, and arrange them your way.
- Drag in charts, tables and headline figures
- Compare up to four lines on one chart
- Filter each widget by channel, device, campaign or page
- Draw goals on any chart, with a pace line
- Add any widget to the ready-made reports too
Compare us with: Looker Studio · Power BI · Databox
CONVERSIONS, GROUPED ONCE
Conversions without the spreadsheet gymnastics.
Every ad network names a lead differently. Here is how you group them in Looker Studio, and how you do it in mDOS.
Getting the data in
Looker Studio Google’s own connectors cover Google products. Meta Ads and LinkedIn Ads come through connectors from other companies.
mDOS Google, Meta, LinkedIn, TikTok and Microsoft Ads are built in, at no extra cost.
Grouping the events
Looker Studio Blend up to five data sources on matching fields, then write a CASE formula to group the events.
mDOS Tick the lead events from each network and call them Enquiries. No formulas.
Using it again
Looker Studio A blend lives inside the report it was made in, so each new report needs its own.
mDOS Name it once for the company, and every report, PDF and share link uses it.
ONE NAME, EVERY REPORT
Name an outcome once. Use it everywhere.
Group events from Google Analytics, your ad accounts, server-side tracking and Google Sheets under one name, like Enquiries or Bookings. Cost per lead and return on ad spend then count only the events you chose.
- Friendly names: "Book Now" instead of the event name your developer typed.
- One outcome, five networks: Google, Meta, LinkedIn, TikTok and Microsoft, side by side.
- Targets on the group: goals and alerts on the outcome you care about, not a blend of everything.
- Fair to say: Looker Studio is free and very flexible. The difference is the set-up each new report needs.
Sources (3) · checked 10 Oct 2026
- Looker Studio blends join up to five data sources, are embedded in the report they were made in and can’t be reused across reports · docs.cloud.google.com
- Values are grouped with a CASE calculated field; chart-level fields exist only in that chart · docs.cloud.google.com
- Meta Ads and LinkedIn Ads aren’t among Google’s own Looker Studio connectors · docs.cloud.google.com
ALREADY CONNECTED
Everything your team does in mDOS is already in your reports.
No set-up and no exports. Bookings, sales, marketing and reviews land in the same reports as they happen.
Bookings and rooms
Covers, bookings, no-shows, occupancy, room rate and revenue per available room.
Events and spaces
Enquiries, packages, spaces and the revenue from every event.
Tills and online orders
Sales by hour, product mix, payment methods and online orders. Tills are in Beta.
Customers and loyalty
New and returning customers, cohorts and lifetime value. Loyalty is in Beta.
Vouchers and memberships
Vouchers sold and redeemed, members, renewals and the revenue from each.
Email and outreach
Sends, opens and clicks, the bookings that followed, and outreach replies by step.
Website and search
Visits, forms, video plays, search rankings and how AI search describes you.
Paid ads
Spend, clicks, conversions and return for every campaign, ad set and ad.
Reviews and team
Ratings and replies by site, and staff performance against takings.
FOR ESTATES
One set of figures for every site.
Head office sees the whole estate, area managers their group and each site its own numbers, all from the same figures.
Any view, any report
The whole company, a brand, a group of sites or one site.
Sites side by side
Each site against its brand average and where it ranks across the company.
Targets that cascade
Set revenue goals once, then change them for a brand or a site.
Unusual days flagged
Takings well outside the normal range are emailed to the site.
The right people, the right sites
What each person sees follows their role.
A daily flash report
Today’s rooms, covers, staffing and takings for a site on one screen.
FOR AGENCIES
Client reporting that builds itself.
Every client’s ads, analytics and results in one place, reported on the schedule they want, without copying a figure.
Every client in one Portfolio
What is waiting and whether each client is on pace for its targets.
Client reports on a schedule
Weekly or monthly, as a designed PDF, Excel or a link.
Board packs in one link
Up to eight reports behind one secure link, with an optional password.
Targets your client agrees
The ROI engine records the client’s agreement before targets go live.
No fee per data source
Connect every ad account and analytics property at no extra cost.
Conversions named your client’s way
One outcome, like Enquiries, across every ad network.
YOUR AI TEAM, ON YOUR NUMBERS
Ask for a dashboard. Get one you can edit.
Our AI team is in Beta. It works around the clock once you switch it on, and nothing goes out without your approval.
Builds the dashboard
Ask Quinn, our data specialist, for a dashboard and it lands in your reports as a normal one you can edit, rearrange and share.
Writes the summary
One click adds a board-ready summary to any dashboard, against last period, last year or target. Edit it before you send it.
Answers questions
Ask what changed and why. It reads your real reports, and flags figures moving well outside their normal range.
Set up by real people, supported by AI. An mDOS Expert Partner sets up your sites, reports and first dashboards with you, and the AI team explains the numbers once you switch it on.
Included with reports & dashboards
Figures you can act on, and trust.
Brand, group or site
See the whole business, one brand, a group of sites or a single site, in the same report.
Money that adds up
Every night, your revenue figures are checked against two separate sources, down to the penny. If they ever disagree, you’re told.
Access by role
People only see the reports and sites their role allows, so site managers get their numbers and head office gets the lot.
Explain any figure
Every figure has an Explain button: what it means, where it comes from and a worked example with your own number.
Honest gaps
If a source couldn’t be read, the report says so instead of showing a zero.
Goals on any chart
Draw a goal or a limit on any chart or figure, with a pace line for monthly goals.
Every feature, in detail
All of it comes with every plan, at one price per site, with no add-ons, no per-user fees and no fee per data connection. Open each area underneath for the rest.
More features, by area
10 features
| Feature | Every plan |
|---|---|
| A board-level view of revenue, channels and top sites | ✓ Included |
| Room revenue, average rate and occupancy for hotels | ✓ Included |
| Revenue per available seat hour for restaurants | ✓ Included |
| Direct against booking-site business, with the commission saved | ✓ Included |
| Marketing results by channel and campaign, for a site, brand or group | ✓ Included |
| Video plays on your website, and how many watched to the end | ✓ Included |
| Online shop customers, cohorts and lifetime value | ✓ Included |
| Menu items by popularity and margin | ✓ Included |
| Labour cost as a share of till takings | ✓ Included Beta |
| Revenue and demand forecasts 30 and 90 days ahead | ✓ Included |
8 features
| Feature | Every plan |
|---|---|
| Every data connection included, with no fee per connection | ✓ Included |
| Google Analytics, refreshed every night | ✓ Included |
| Google, Meta, LinkedIn, TikTok and Microsoft Ads, down to each ad | ✓ Included |
| Search Console and AI search visibility | ✓ Included |
| Google Sheets, with your own columns mapped to figures | ✓ Included |
| Mailchimp and subscription data in the e-commerce reports | ✓ Included |
| Your own systems: send any figure to a secure link and chart it straight away | ✓ Included |
| Custom connections at no extra cost | ✓ Included |
5 features
| Feature | Every plan |
|---|---|
| Name an outcome once, like Enquiries, from events in any source | ✓ Included |
| The same names in every report, PDF and share link | ✓ Included |
| One outcome across five ad networks | ✓ Included |
| Cost per lead and return on ad spend from only the events you chose | ✓ Included |
| Your own funnels, with the drop-off at each step | ✓ Included |
9 features
| Feature | Every plan |
|---|---|
| One goal worked back into a target for every stage | ✓ Included |
| Nine ready-made service funnels, from paid ads to reviews | ✓ Included |
| Every figure shows its source and how sure it is | ✓ Included |
| Targets go live only when you or your client agree them | ✓ Included |
| Target, actual and forecast for every stage, with a verdict | ✓ Included |
| The weakest stage named, and a likely date for the goal | ✓ Included |
| Required spend, break-even return on ad spend and lifetime value | ✓ Included |
| Revenue goals for each stream, set once and changed for a brand or site | ✓ Included |
| Alerts when a figure crosses a line you set | ✓ Included |
8 features
| Feature | Every plan |
|---|---|
| Any report emailed daily, weekly or monthly | ✓ Included |
| Sent as a link, a designed PDF, Excel or CSV | ✓ Included |
| Send a scheduled report now, without waiting | ✓ Included |
| Secure read-only links for people outside your team | ✓ Included |
| Password-protected links, with downloads on or off | ✓ Included |
| Up to eight reports behind one link for a board pack | ✓ Included |
| Export to CSV, Excel or PDF | ✓ Included |
| Reports on your phone in the Manager app | ✓ Included |
5 features
| Feature | Every plan |
|---|---|
| The whole company, a brand, a group of sites or one site | ✓ Included |
| Each site against its brand average and company ranking | ✓ Included |
| People only see the sites their role allows | ✓ Included |
| Unusual days flagged and emailed to the site | ✓ Included |
| Every client in one Portfolio, paced to target | ✓ Included |
4 features
| Feature | Every plan |
|---|---|
| Ask for a dashboard and get one you can edit | ✓ Included Beta |
| A board-ready summary of any dashboard, which you can edit | ✓ Included Beta |
| Questions about your figures answered from your real reports | ✓ Included Beta |
| Forecast figures worked out in code, never by the AI | ✓ Included |
3 features
| Feature | Every plan |
|---|---|
| One revenue definition in every report | ✓ Included |
| A failed source is labelled, never shown as a zero | ✓ Included |
| An Explain button on every figure, with a worked example | ✓ Included |
What it replaces
Reporting without the copying and pasting.
Power BI or Looker Studio
Tools that need someone to build blends and formulas for each report. Here your data is already joined up and conversions are named once.
Supermetrics or AgencyAnalytics
Tools that pull marketing figures into reports for a monthly fee. Here every connection is included, and so are your bookings and sales.
Monday-morning spreadsheets
Copying figures from each system into a weekly report. Reports update themselves and can be emailed to you.
Switch at your own pace
Start with the ready-made reports and build your own when you’re ready. Keep your current reporting tools while their contracts run out, we move your history across, and we plan the switch with you.
Three things no one else brings together
Reports show you the numbers. mDOS adds AI agents that explain them, and experts who turn them into a plan.
World-leading software
Ready-made reports, dashboards you build in minutes and every data source connected, from what you spend to what you take.
Tireless AI agents
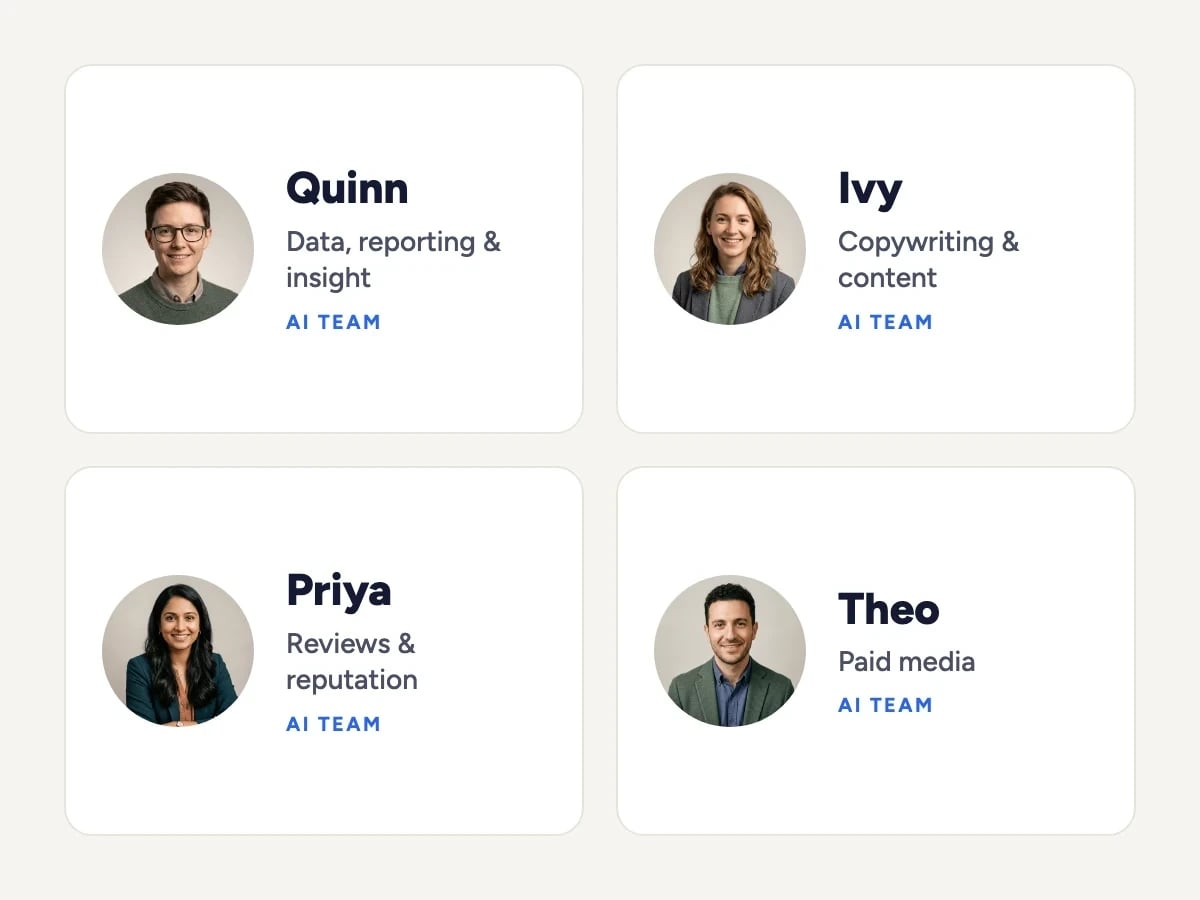
Ask Quinn, our AI data specialist, for a dashboard and it lands ready to edit. AI agents also write board-ready summaries and flag figures moving out of range.

Real experts driving it
An mDOS Expert Partner sets up your sites, reports and first dashboards with you, and our marketers use the same numbers to agree what to do next.
Keep the tools that work for you. Replace the ones that don't.
Sell online already? Keep your shop and email tools, and bring the customer data, campaigns and reporting into one place.
Support from a real marketing team
mDOS is built and operated by MDOS AI LTD. When you message or phone us, real Marketing Experts answer, on every plan, led by our Founding Partner Agency, Mr Digital. Here are five ways we help you get results.
Chat with our marketing experts
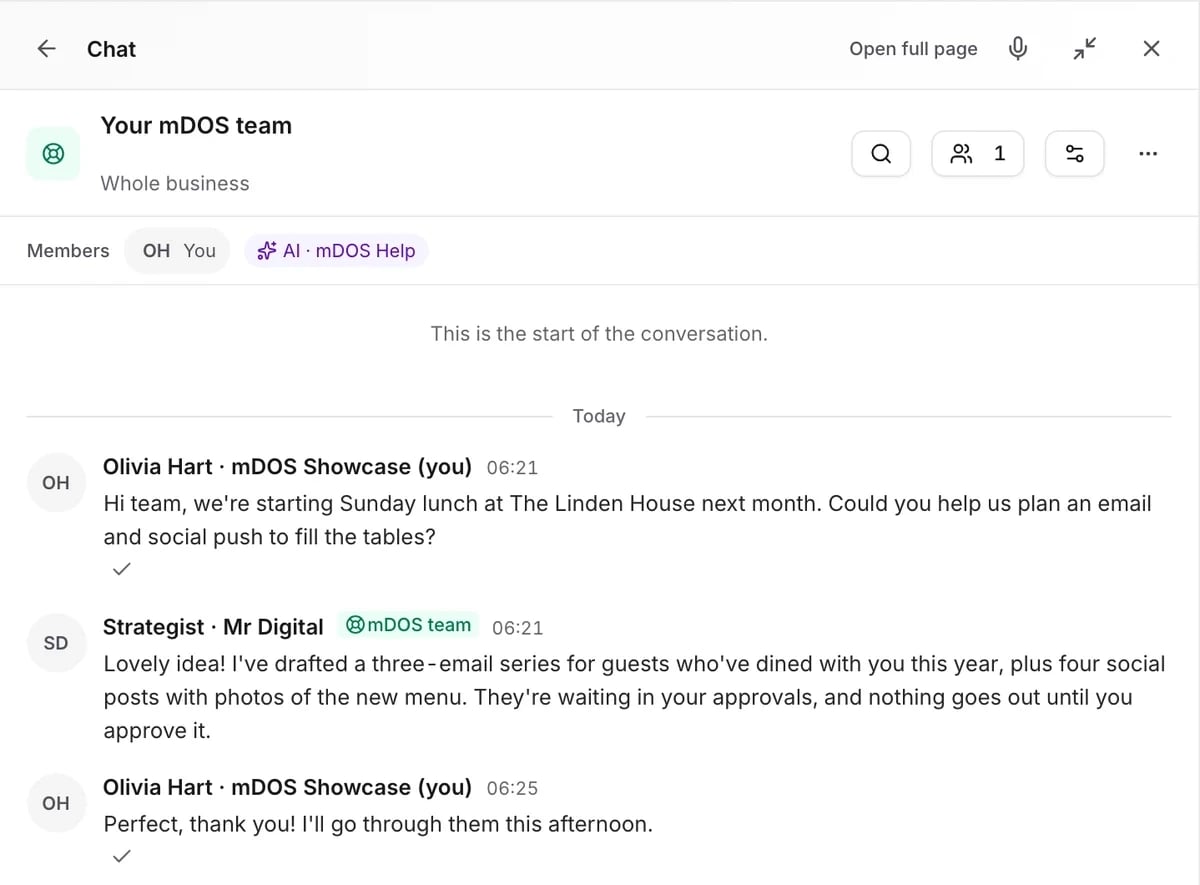
Message us from any screen in mDOS. The people who answer are marketers from our partner agencies, not a call centre.
- Live chat on every plan, from the Chat button on every page, and you can phone us when you need to
- Answered by marketing experts from our partner agencies, the same people who run marketing for clients
- Ask about the software or your marketing: setup, campaigns and results
- AI support for quick answers whenever you need one
Included in every plan