
Live estate reporting
What multi-site hospitality CFOs actually need to see, and why most stacks can't show it.

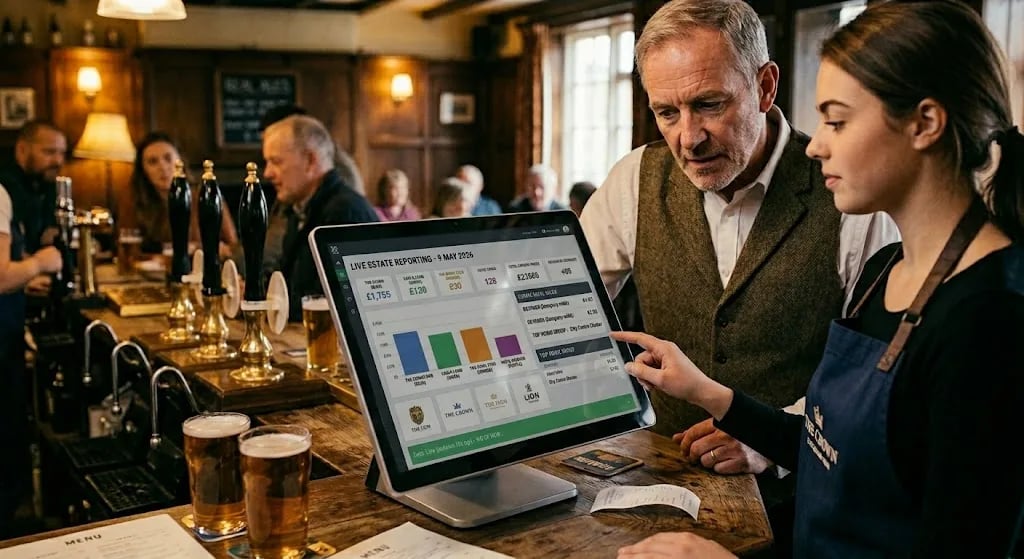
Most boardroom reporting in hospitality is a presentation built by a finance analyst on Tuesday morning showing what happened the previous week. The data is reliable, the formatting is consistent, the analyst is competent. The problem is that by the time anyone looks at it, the operational reality it describes is a week old.
For a single-site operator, this is fine. The week-old picture is detailed enough to make next-week decisions. For a multi-site operator running 50, 200, or 1,000 venues, the week-old picture is a strategic liability. Decisions get made on stale data because the stack can't produce fresh data without that analyst.
This article is about what real estate-wide reporting looks like when the executive dashboard is one query away from the operational source, and the honest architectural trade-offs that make it work.
The problem with most hospitality reporting
Most multi-site hospitality groups have a fragmented stack: PMS for hotels, POS for F&B, channel manager for OTAs, booking platform for tables, loyalty system for memberships, marketing platform for email, CRM for B2B sales, separate reporting tool layered over all of them.
Each system has its own reporting layer. Each reporting layer answers questions in its own format, against its own data model, on its own refresh cycle. Cross-system questions (the ones the board actually asks) require manual reconciliation.
A representative board question: "Which venue groups had the highest revenue-per-available-seat-hour last quarter, broken down by brand, and how did it compare to the same quarter last year?"
In a fragmented stack, answering this question requires:
- Exporting POS data from the POS vendor's reporting tool (per venue, per month, manually combined)
- Exporting booking data from the booking vendor (different format, requires reconciliation against POS to avoid double-counting)
- Resolving venue grouping in a separate spreadsheet (because no single system knows about "venue groups" as a cross-brand cluster)
- Calculating REVPASH manually (revenue ÷ available seat-hours), because no system reports it natively
- Year-on-year comparison via another set of exports for the equivalent period
By the time the analyst finishes, three days have passed. The number is correct. The number is also too late to act on. By the time the board meets to discuss it, another week has gone by.
This isn't a failure of the analyst. It's a failure of the architecture.
What changes when reporting lives in the same database
The mDOS reporting architecture takes a different position. There's no separate reporting database. There's no ETL job that moves operational data to a warehouse overnight. The executive dashboard runs SQL queries directly against the same Postgres tables that the POS, the PMS, the booking system, and the loyalty engine are writing to in real time.
This sounds like a performance disaster. It would be, if the architecture were naive. It isn't.
The actual design is hybrid. Operational dashboards (the ones venue managers and area managers look at hour-to-hour during service) run as live queries against the operational tables. These are scoped to a single venue or a small group of venues, so the query plans are fast (sub-second p95 across the platform's measured load tests). The data is fresh to the moment of the page load.
For cross-estate executive rollups, the platform also maintains a precomputed snapshot layer: a scheduled job (running on Trigger.dev, our managed scheduler) aggregates the operational data into a snapshot table nightly at 3am UTC. At the platform's current scale the executive dashboards still serve these rollups as live cross-estate queries (also sub-second under the measured load tests); reading from the precomputed snapshot table is the scale path as estates grow toward "all 300 venues, full transaction history, year-on-year," where live aggregation would eventually become too slow to be useful.
The platform is honest about the trade-off. Operational dashboards show "as of now." The snapshot layer, once an executive surface reads from it, shows "as of 3am today": instant to load but up to 24 hours stale. Either way, if the CFO needs current-shift data for a specific decision, they drill into the operational dashboard and get it live.
The four scopes that make estate analysis actually work
The reason cross-system questions are so hard in fragmented stacks is that no individual system knows about the customer's true organisational structure. The POS knows about venues. The booking platform knows about venues. The CRM might know about brands. Nothing knows about arbitrary cross-brand clusters.
mDOS resolves this via four scope levels, baked into the reporting layer at the architectural level.
Company scope: all venues across the entire estate. The underlying reports simply run with no venue filter.
Brand scope: all venues under a specific brand, found by looking up the venues that belong to that brand.
Venue group scope: arbitrary cross-brand clusters, defined by listing which venues belong to each group. A venue can sit in many groups, and groups never cross companies. This is the one most competitors can't do. A group like "all city-centre venues across all brands" is a single venue group in mDOS, queryable in a single query. In a fragmented stack, this query requires combining brand-specific reports from multiple vendor systems and reconciling them manually.
Venue scope: single property. The standard single-venue view.
The board question that previously took three days ("Which venue groups had the highest REVPASH last quarter, broken down by brand, year-on-year?") is now one filter selection in the dashboard. The query runs in under a second against the snapshot table. The CFO has the answer before the next agenda item starts.
What the executive dashboard actually shows
The executive overview surfaces these metrics estate-wide, with cross-scope drill-down:
Revenue across five streams (POS, accommodation, table dining, OTA, channel manager) summed into a single estate-wide figure. RevPAR, ADR, occupancy percentage from a dedicated hotel KPI calculation. REVPASH calculated natively. B2B revenue split surfaced separately.
Covers and turn times across the dining venues, with capacity utilisation percentages, day-of-week distribution, and no-show rates. Loyalty group-wide membership counts, tier distribution, redemption rates, and top rewards. Corporate point-pool balances and contact lifetime value at the 75th percentile threshold.
Email and SMS send volume, open rates, click-through rates by campaign and flow. Funnel conversion percentages with step-level revenue attribution and UTM tracking. Channel mix across direct, OTA, organic, and paid. Group average review score with sentiment scoring over time.
All of this is filterable across the four scopes (company, brand, venue group, venue), bucketable by day/week/month, and comparable against previous period or same-period-last-year. The timezone resolution is venue-aware: when the CFO compares London venues to New York venues, the comparison respects each venue's local trading hours rather than naive UTC.
One honest gap
This article shouldn't pretend the architecture is perfect.
One legacy reporting endpoint (POS reporting) currently uses a deprecated single-venue parameter and doesn't honour venue-group scoping. It silently falls back to single-venue. The fix is in progress and ships this sprint. Once shipped, all reporting endpoints honour the four-scope model uniformly.
We mention this because acquirer due diligence will find it. The cost of pretending otherwise is much higher than the cost of being explicit.
Why this matters for boardroom decisions
The CFO of a 200-venue hospitality group makes a small number of decisions per quarter that materially affect the P&L. The quality of those decisions depends on the freshness, accuracy, and granularity of the data they're working from.
A reporting architecture that delivers cross-estate REVPASH in one second, drillable to venue groups, with year-on-year comparison built in, changes the decision tempo. Boards move from "review last quarter's analyst report" to "explore live questions in the dashboard during the meeting." Strategic conversations get sharper because the data supporting them is closer to operational reality.
A reporting architecture that delivers the same data three days later, via manual reconciliation, makes those conversations slower, vaguer, and more reliant on intuition. The intuition might be right. It also might not be. The architecture should be removing that uncertainty, not preserving it.
This is what live estate reporting is for. It's not about replacing analysts: analysts add real value via interpretation and recommendation. It's about ensuring that the analyst's time is spent on interpretation, not on the mechanical work of stitching together five vendor exports to produce a number that should be one query away in the first place.
The reporting architecture is built on Postgres with hybrid live/snapshot queries. Methodology documentation available under mutual NDA.
Get the full white paper
The five data black holes, and a checklist to find them in your business.
About the author
Ross Crawford is the founder of Mr Digital and mDOS, and a Fellow of the Chartered Institute of Marketing (FCIM). He has worked in hospitality marketing since 2008, when he started at Fuller’s.
- Fellow of the Chartered Institute of Marketing (FCIM)